Programatically exploring Linux /proc filesystem
The /proc file system acts as an interface for Linux kernel data structures as described in proc(5). It exposes information about your system, including things such as kernel state, hardware information, and processes currently running on the system.
Programs such as ps and top are built entirely on top of this pseudo file system.
It’s important to remember that /proc is not a real file system. Files often report a length of zero, their contents are generated on demand, and reading the same file twice can return different values. This behaviour makes sense once you realize you are reading live kernel data, not data stored on disk.
In this article we will explore various parts of this file system, building up our ideas into a simplified version of top, which we will call mini-top.
Finding running processes:
ps -e lists all running processes including its PID (process ID) TTY, time, and the CMD (process name):
    PID TTY          TIME CMD
      1 ?        00:00:06 systemd
      2 ?        00:00:00 init-systemd(Fe
      9 ?        00:00:00 init
     52 ?        00:00:00 systemd-journal
     65 ?        00:00:00 systemd-userdbd
     97 ?        00:00:00 systemd-udevd
    153 ?        00:00:01 systemd-oomd
    154 ?        00:00:01 systemd-resolve
    174 ?        00:00:00 dbus-broker-lau
    175 ?        00:00:00 dbus-broker
    176 ?        00:00:00 NetworkManager
    177 ?        00:00:05 systemd-homed
    179 ?        00:00:00 systemd-logind
... and so forth
if we take a look at the /proc directory we can notice an interesting pattern:
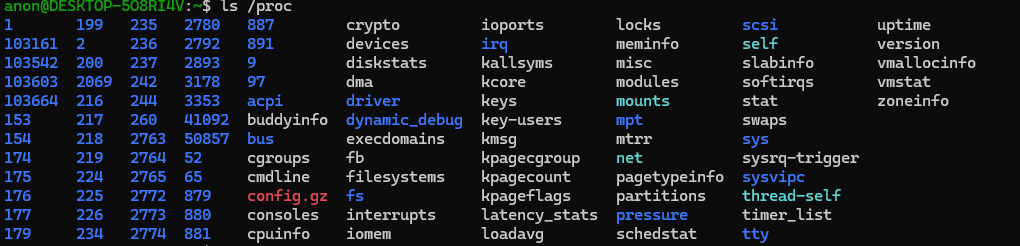
The PIDs listed with ps -e seem to be the names of sub directory’s in /proc.
This is due to the fact that each running process gets its own sub directory in /proc. This sub directory is named the PID of the process. Within these sub directory’s, we can find out information about each running process.
Knowing this, we can write a small program that produces an output similar to ps -e by walking the /proc directory directly.
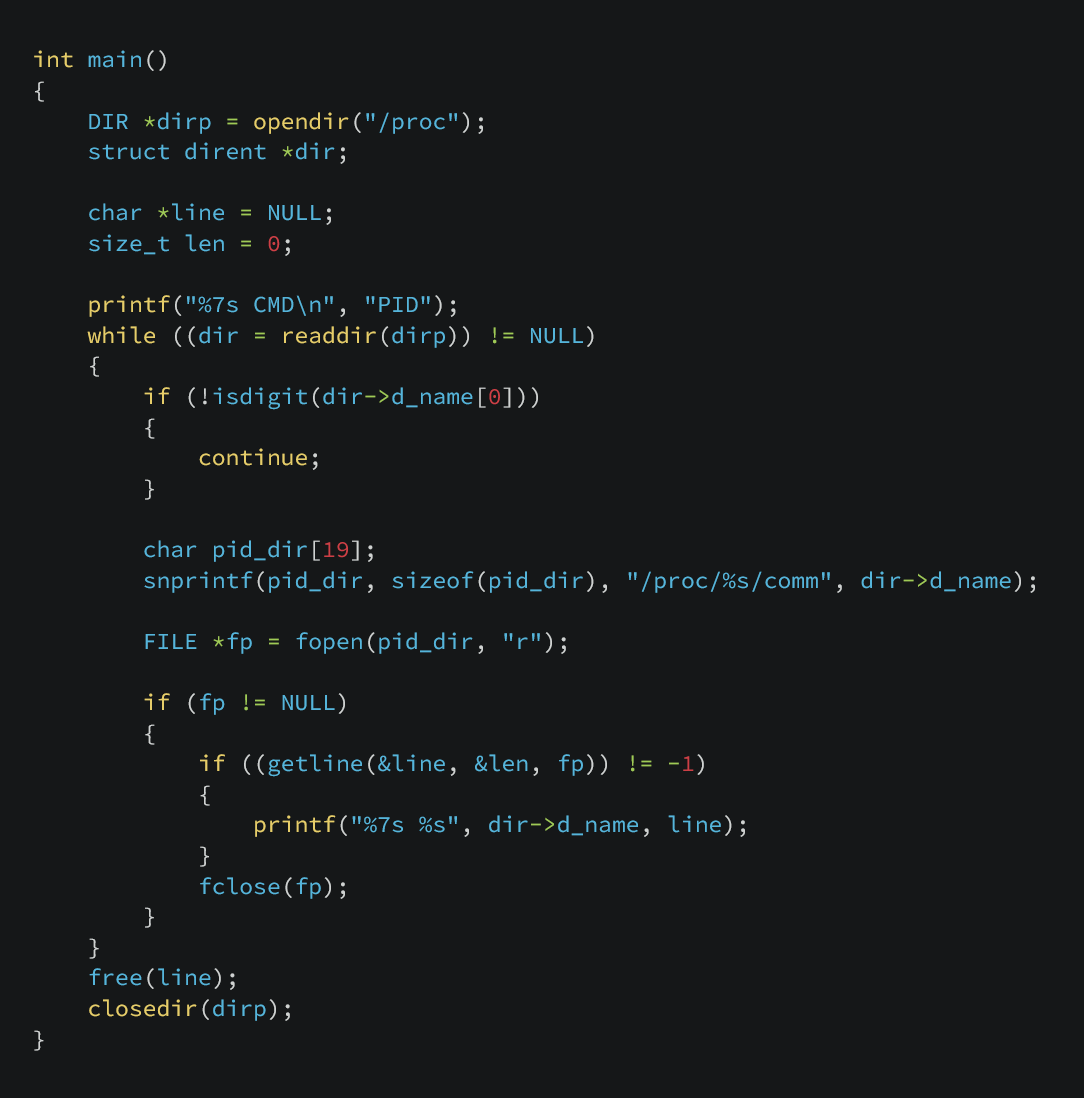
This program opens the /proc directory, enumerates each sub directory and filters out any directory that is non numeric. Since /proc contains no directories starting with digits other than PIDs, this is suitable to identify running processes.
For each process we open /proc/<pid>/comm, which contains the task name of the process, which essentially is the program name. We read the first line of the file, which gives us the name.
We then print the PID and the contents of the comm file.
This is the output when running this program:
   PID CMD
     1 systemd
     2 init-systemd(Fe
     9 init
    52 systemd-journal
    65 systemd-userdbd
    97 systemd-udevd
   153 systemd-oomd
   154 systemd-resolve
   174 dbus-broker-lau
   175 dbus-broker
   176 NetworkManager
   177 systemd-homed
   179 systemd-logind
... and so forth
As you can see, it is the same output as ps -e (minus tty, and time). This version will not include the tty and time fields, although that information is available through /proc, I have left it out for this demonstration.
Measuring system CPU usage:
In order to measure system CPU usage, its important to understand CPU usage is not a value, but is computed from a time spent executing. To calculate CPU usage, you must take two readings at different points in time and compute the delta between them.
The kernel exposes CPU statistics in /proc/stat as cumulative counters (measured in jiffies) that only ever increase. A jiffy is the kernel’s basic unit of time, representing one tick of the system timer. These values represent the total amount of time the CPU has spent in various states since boot. Because of this, CPU usage cannot be determined from a single read but from the change in these counters over a known time interval.
For example, suppose at time t0 the CPU has accumulated 1000 jiffies in user mode, and at time t1 = t0 + 1s it accumulated 1100 jiffies in user mode.
The CPU therefor has spent 100 jiffies executing user mode code over that one second interval.
If we want percentage, we must compare how many jiffies were spent doing work vs total jiffies during that interval.

if we cat /proc/stat/ we get an output that looks like this:
cpu  115621 549 300188 145566315 8780 0 56200 0 0 0
cpu0 5446 2 15106 9098547 1115 0 48323 0 0 0
cpu1 3828 0 12831 9107570 1389 0 5454 0 0 0
cpu2 8094 0 25685 9087548 1514 0 1242 0 0 0
cpu3 4898 16 13377 9104843 2820 0 254 0 0 0
cpu4 10124 38 23720 9088623 456 0 189 0 0 0
...
We only care about the first line for our demonstration. This line gives us the total jiffies the CPU spent in each state. The meanings of the columns are as follows, from left to right, disregarding the CPU column:
user: normal processes executing in user mode (
115621)nice: niced processes executing in user mode (
549)system: processes executing in kernel mode (
300188)idle: twiddling thumbs (
145566315)iowait: waiting for I/O to complete (
8780)irq: servicing interrupts (
0)softirq: servicing softirqs (
56200)steal – time stolen by other OSs in a virtualized environment (0)
guest – running a virtual CPU (VM guest) (0)
guest_nice – running a niced VM guest (0)
The following code illustrates this in practice:
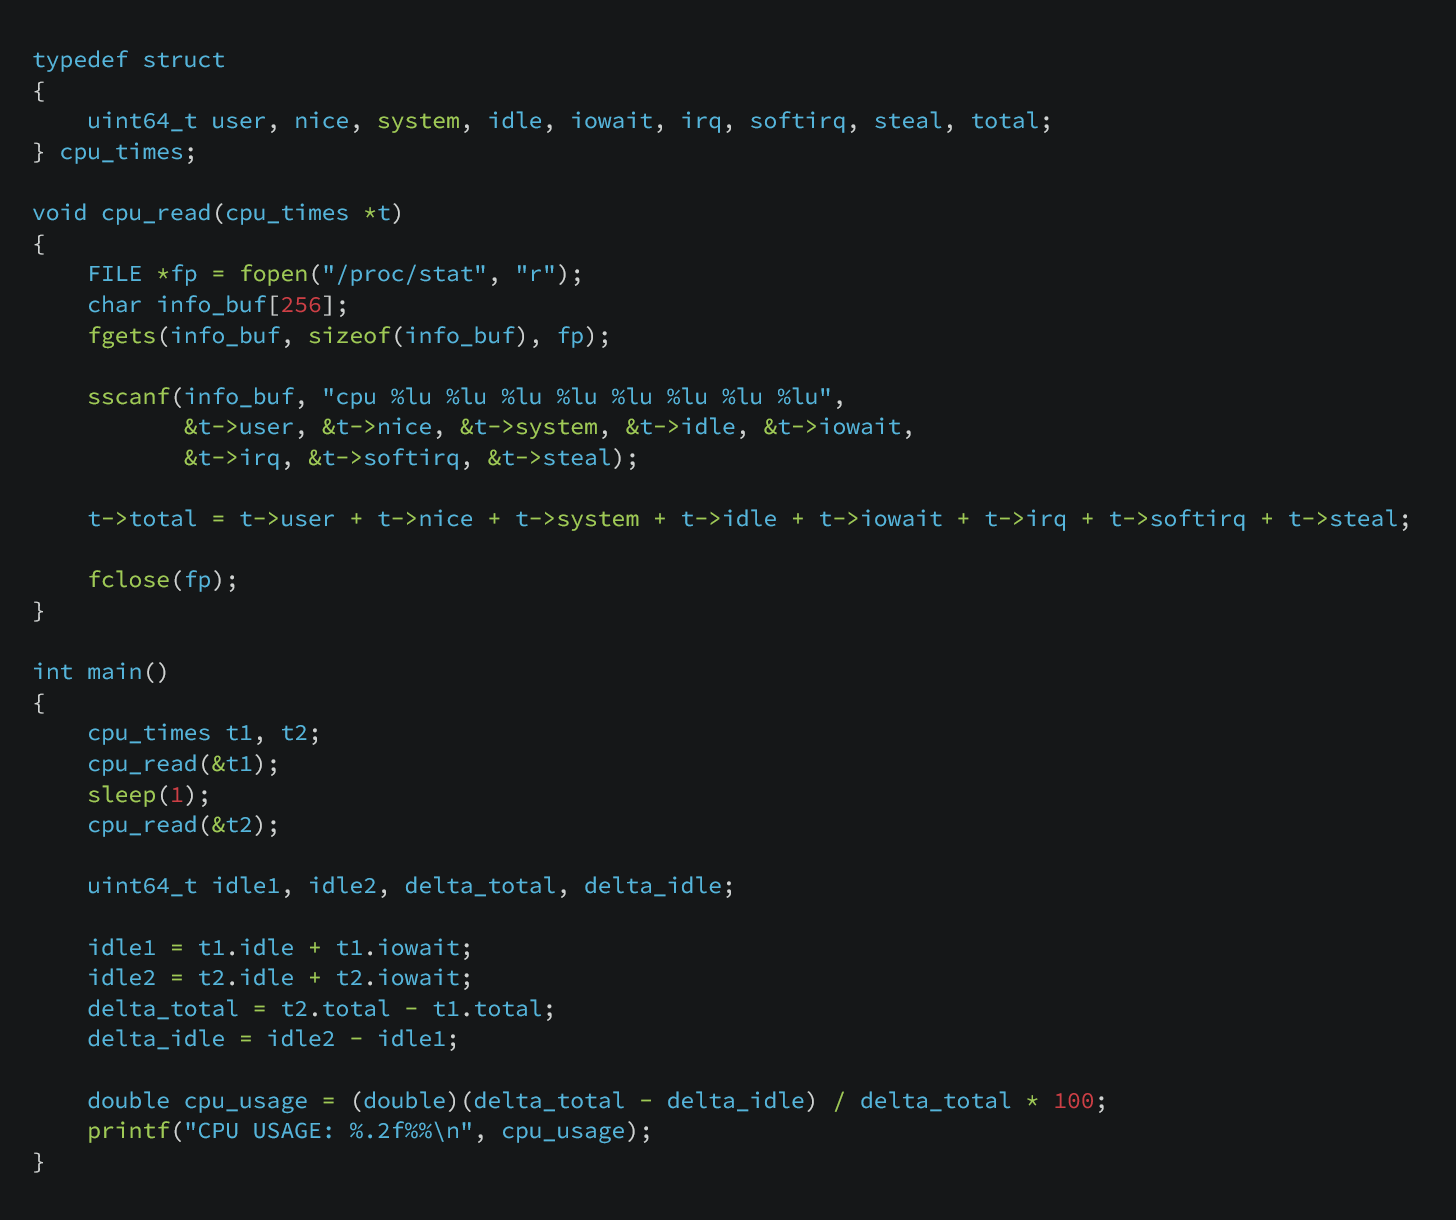
We start by taking a snapshot of /proc/stat, storing the CPU time fields and summing them to obtain the total number of jiffies. We then sleep for one second and take a second snapshot.
From each snapshot, we also record the idle-related jiffies (idle and iowait), which represent time the CPU was not executing useful work.
We compute the delta between the two snapshots for both the total jiffies and the idle jiffies. Subtracting the idle delta from the total delta gives us the amount of time the CPU spent doing work during the interval.
Finally, we divide the work delta by the total delta and multiply by 100 to calculate CPU usage as a percentage as our formula listed above.
This is the output of this program:
anon@DESKTOP-5O8RI4V:~/projects/pid/cpu_info$ ./cpu_info
CPU USAGE: 0.12%
Measuring system memory usage:
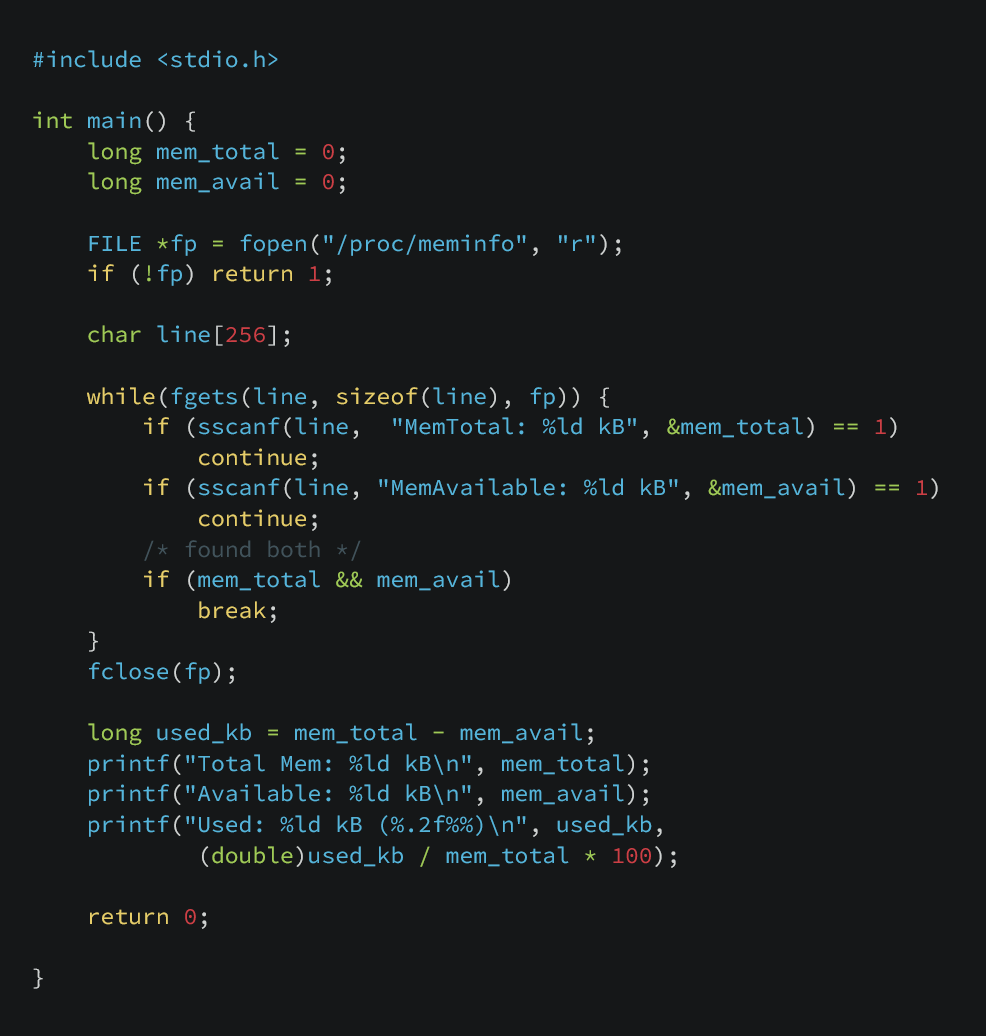
Luckily reading memory usage is fairly straightforward. No messing about with time deltas. We just need to open the /proc/meminfo file.
anon@DESKTOP-5O8RI4V:~/projects/pid/cpu_info$ cat /proc/meminfo
MemTotal:        8081588 kB
MemFree:         6159136 kB
MemAvailable:    6569712 kB
Buffers:          107508 kB
Cached:           444676 kB
SwapCached:            0 kB
Active:           348328 kB
Inactive:        1174580 kB
...
We can see lines of interest with their values listed in kB. Were interested in the MemTotal and MemAvailable lines. We can subtract MemAvailable from MemTotal to to give us the kB currently being used. Now we can calculate used / available * 100 to give us percent used.
Here is the output of the program.
anon@DESKTOP-5O8RI4V:~/projects/pid/mem_info$ ./mem_info
Total Mem: 8081588 kB
Available: 6569320 kB
Used: 1512268 kB (18.71%)
Measuring memory of process:
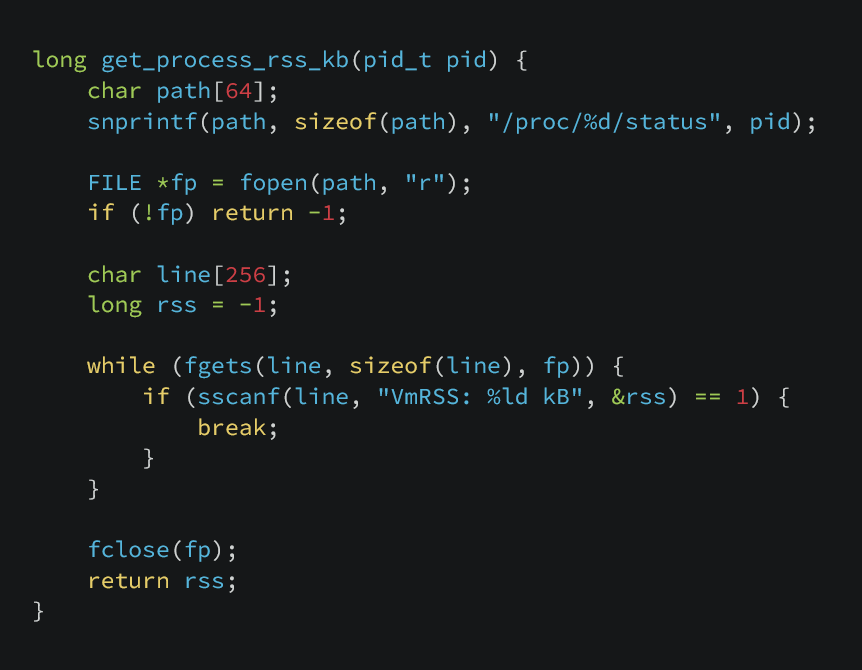
Seeing how much memory any given process is using is similar, except that were reading from /proc/<PID>/status and looking for the line VmRSS.
anon@DESKTOP-5O8RI4V:~$ cat /proc/1/status
Name:   systemd
Umask:  0000
State:  S (sleeping)
...
Kthread:        0
VmPeak:    22508 kB
VmSize:    22316 kB
VmLck:         0 kB
VmPin:         0 kB
VmHWM:     12896 kB
VmRSS:     12896 kB
...
Creating Mini-Top:
We can take the functionality of these small programs and bring them together to write mini-top, a simplified version of top. The top command is a real-time process monitor for Linux that displays a live, updating view of system resource usage. Our version should list system CPU & memory use, all running processes sorted by cpu usage, with each process displaying its PID, memory usage, and cpu usage. For the sake of this article, we will keep all the code in one c file. Full code available here.
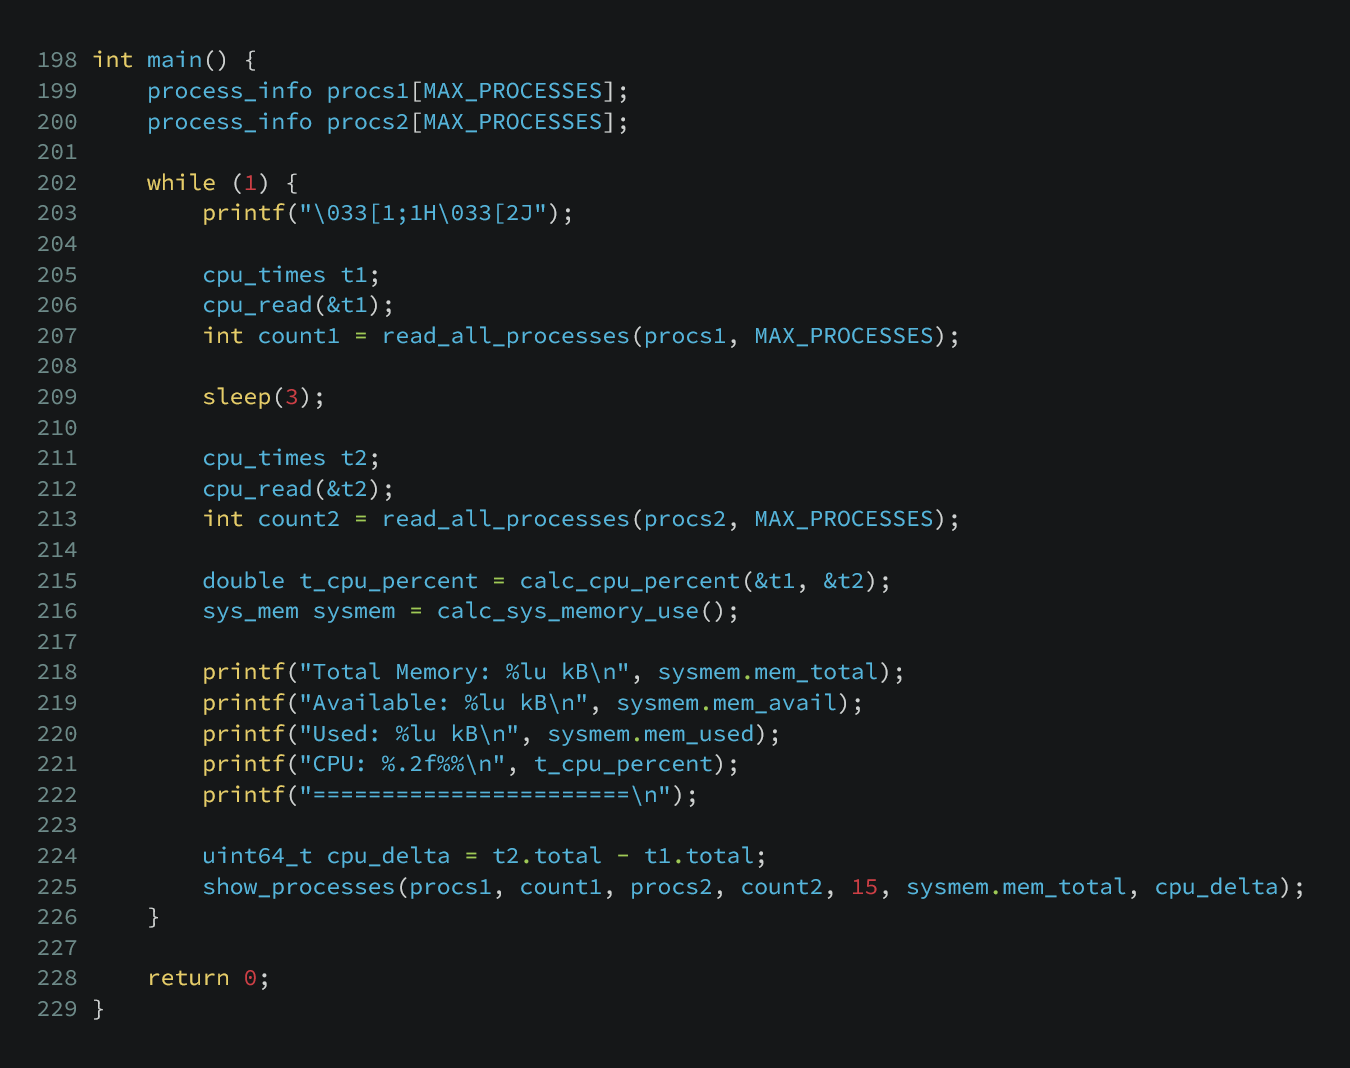
Here’s the output of mini-top:
Total Memory: 8081600 kB
Available: 6745852 kB
Used: 1335748 kB
CPU: 0.44%
=======================
    PID   CPU%   MEM% CMD
    669    2.7    7.7 node
    468    0.7    0.9 node
   2828    0.3    0.1 systemd-userwor
      1    0.0    0.2 systemd
      2    0.0    0.0 init-systemd(Fe
      9    0.0    0.0 init
     52    0.0    0.2 systemd-journal
     65    0.0    0.1 systemd-userdbd
     97    0.0    0.1 systemd-udevd
    155    0.0    0.1 systemd-oomd
    156    0.0    0.2 systemd-resolve
    174    0.0    0.1 dbus-broker-lau
    175    0.0    0.0 dbus-broker
    176    0.0    0.2 NetworkManager
    177    0.0    0.1 systemd-homed
It refreshes every 3 seconds, matching top. If you run this alongside top you will see the results are similar, only varying slightly due to when they are taking system snapshots.
Output of top:
%Cpu(s):  0.1 us,  0.4 sy,  0.0 ni, 99.5 id,  0.0 wa,  0.0 hi,  0.0 si,  0.0 st
MiB Mem :   7892.2 total,   6180.2 free,   1302.5 used,    580.5 buff/cache
MiB Swap:   2048.0 total,   2048.0 free,      0.0 used.   6589.6 avail Mem

    PID USER      PR  NI    VIRT    RES    SHR S  %CPU  %MEM     TIME+ COMMAND
    669 anon      20   0   52.3g 622404  64128 S   2.7   7.7   0:22.01 node
    468 anon      20   0 1083228  73396  48000 S   0.7   0.9   0:01.66 node
      1 root      20   0   22408  13016  10072 S   0.0   0.2   0:00.75 systemd
      2 root      20   0    3120   1920   1920 S   0.0   0.0   0:00.01 init-systemd(Fe
      9 root      20   0    3120   1792   1792 S   0.0   0.0   0:00.00 init
     52 root      20   0   65892  16772  15876 S   0.0   0.2   0:00.17 systemd-journal
     65 root      20   0   15604   6144   5376 S   0.0   0.1   0:00.04 systemd-userdbd
     97 root      20   0   32164   9472   8064 S   0.0   0.1   0:00.15 systemd-udevd
    155 systemd+  20   0   16160   7168   6272 S   0.0   0.1   0:00.12 systemd-oomd
    156 systemd+  20   0   20736  12800  10496 S   0.0   0.2   0:00.16 systemd-resolve
    174 dbus      20   0    9208   4540   3840 S   0.0   0.1   0:00.02 dbus-broker-lau
    175 dbus      20   0    5420   3220   2688 S   0.0   0.0   0:00.02 dbus-broker
    176 root      20   0  330648  18432  16256 S   0.0   0.2   0:00.07 NetworkManager
    177 root      20   0   16428   7680   6528 S   0.0   0.1   0:00.11 systemd-homed
    181 root      20   0   16424   8064   7040 S   0.0   0.1   0:00.05 systemd-logind
    202 root      20   0    7892   3072   2816 S   0.0   0.0   0:00.00 agetty
We were able to do all of this, simply by reading and comparing values in /proc.